Table of Contents
The line charts in TSDS are used to show data change over time, and share a number of
common features.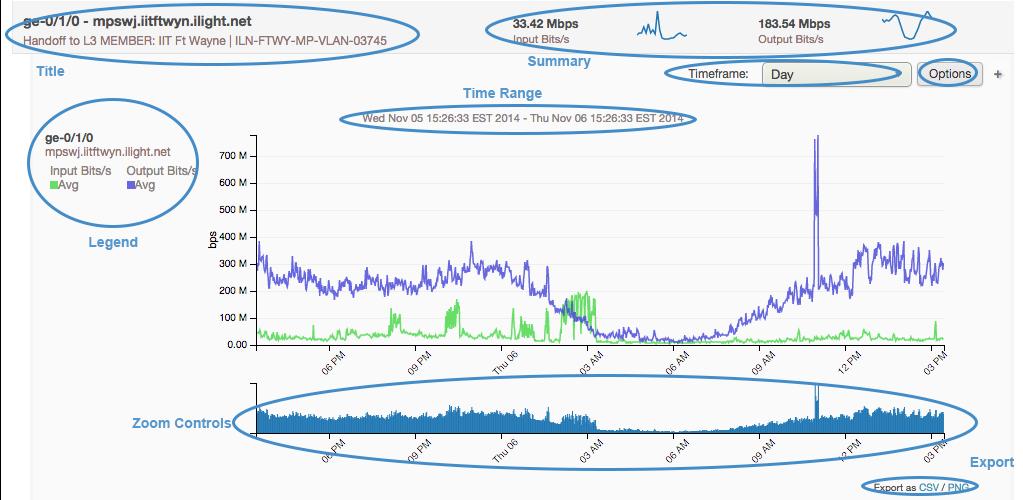
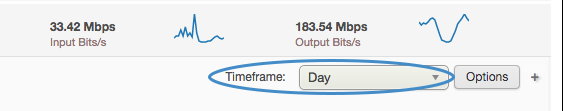
To change the timeframe the chart spans, click the Timeframe selector.
Here, the desired timeframe can be selected. Simply click on the desired time range.
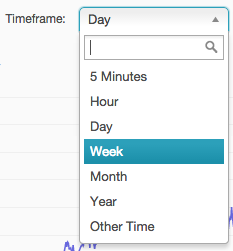
Or, a custom time range can be entered by clicking "Other Time" and entering dates and times.

Rather than typing the start and end times, click the calendar buttons to use the selector. Navigate the months, click on the desired day, and use the dropdown menus to select the desired time.
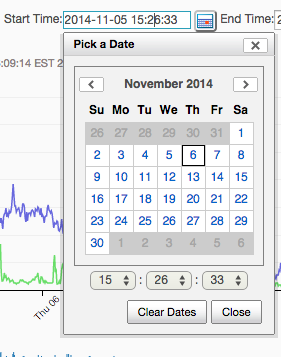
If entering a custom time range, click Go to have the chart redraw with the desired range.
