The layout of a portal depends on how it was designed. See the Forge section for information on designing portals.
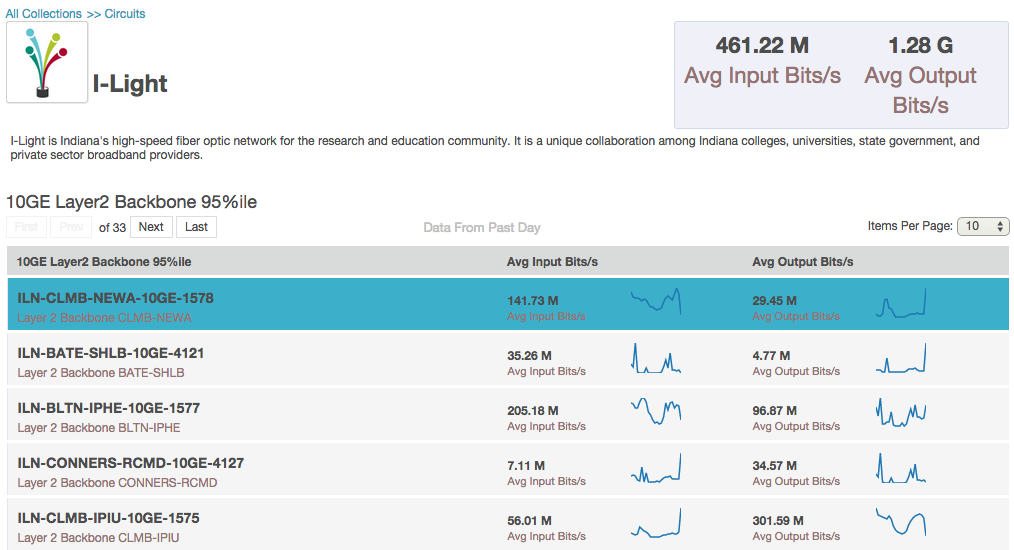
Note the summary information displayed in the header of the page. This is summary data incorporate adding up the Input and Output bps for all of the circuits listed.
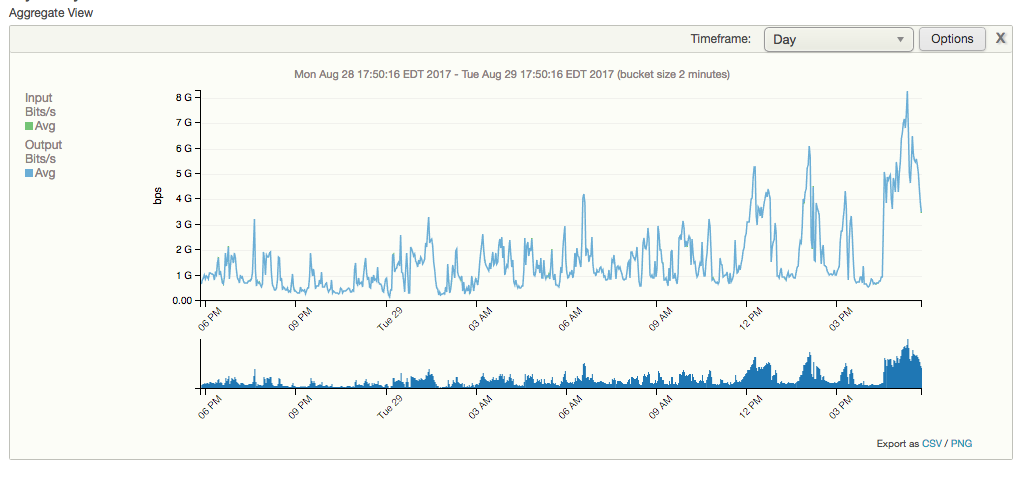
At the top of the portal view is an aggregate graph representing the summation of all of the elements in the report. By default all elements are aggregate together, but this view can be changed through the "Options" button to separate items into separate lines.
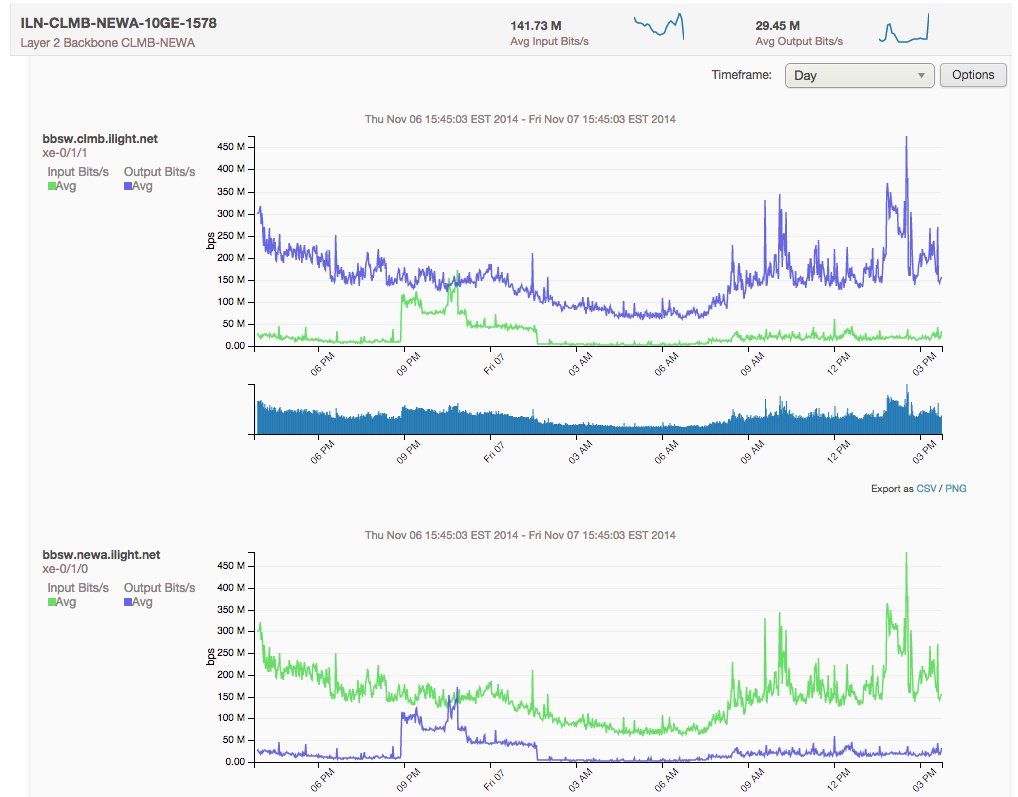
Click a circuit to view the charts for that circuit.