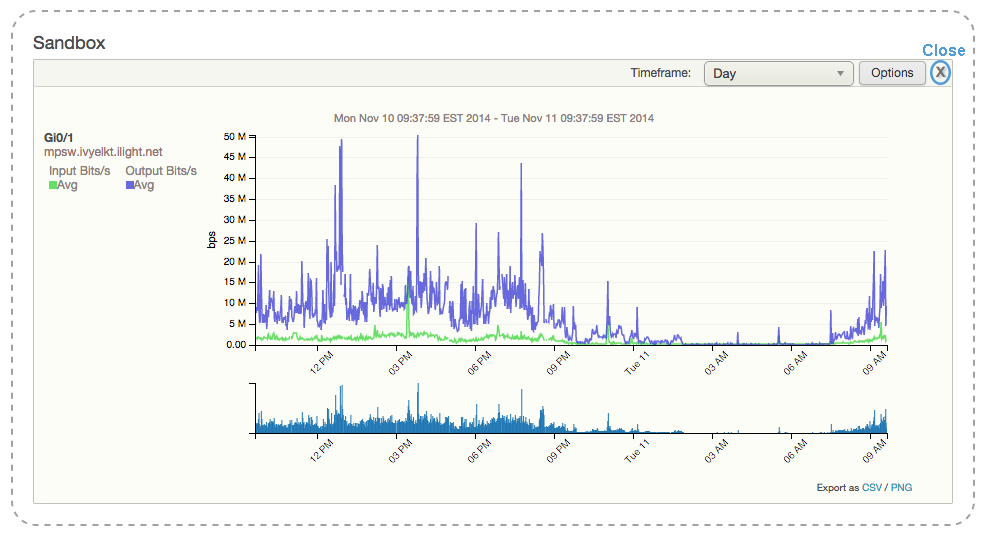
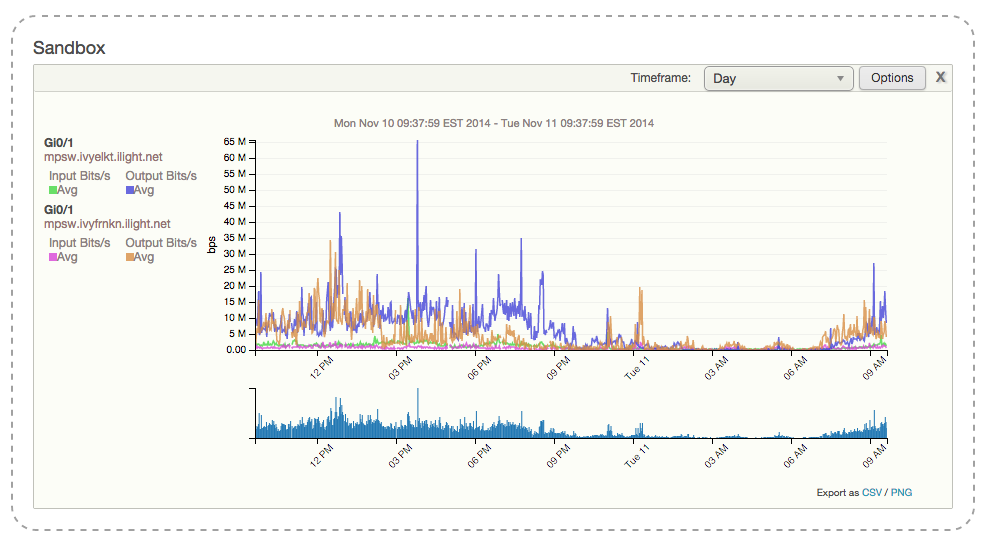
The Sandbox is the section underneath the Data Explorer which allows users to arbitrarily combine charts. Charts of different measurement types can be combined and viewed here.
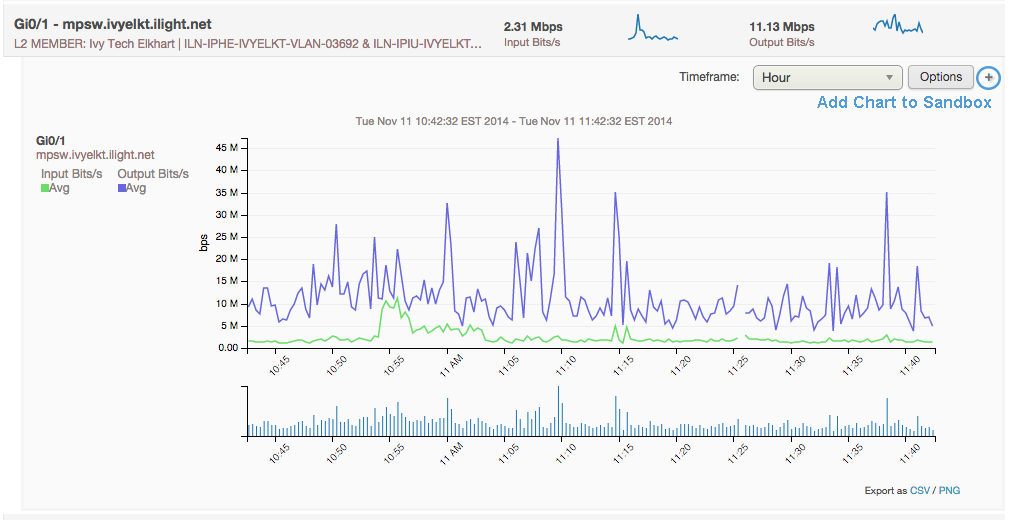
Charts in Data Explorer can be added to the Sandbox by clicking the '+' button in upper right corner of the chart’s container.

Once clicked, the chart is added to the Sandbox. The content of the Sandbox remains the same even after the measurement type is changed in the Browse section. The Sandbox can be removed at any time by clicking the ‘X’ button located in the upper right corner of the Sandbox.

When more than one chart is added to the Sandbox, the graphs are overlaid by default.
